Code
import numpy as np
import matplotlib.pyplot as plt

r = np.arange(0, 2, 0.01)
theta = 2 * np.pi * r
fig, ax = plt.subplots(
  subplot_kw = {'projection': 'polar'}
)
ax.plot(theta, r)
ax.set_rticks([0.5, 1, 1.5, 2])
ax.grid(True)
plt.show()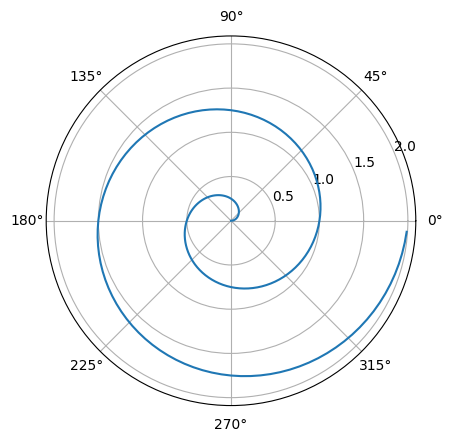
For a demonstration Jupyter notebook blog
For a demonstration of a line plot on a polar axis, see Figure 1.
import numpy as np
import matplotlib.pyplot as plt
r = np.arange(0, 2, 0.01)
theta = 2 * np.pi * r
fig, ax = plt.subplots(
subplot_kw = {'projection': 'polar'}
)
ax.plot(theta, r)
ax.set_rticks([0.5, 1, 1.5, 2])
ax.grid(True)
plt.show()
@online{khatke2022,
  author = {Khatke, Ashish},
  title = {Jupyter {Notebook} {Blog}},
  date = {2022-12-30},
  url = {https://khatkeashish.github.io/posts/2022-12-30_sample-post},
  langid = {en}
}